How I Created a Data-Driven Infographic on Solar Homes, Blockchain, and AI Energy
Project Overview
I led the end-to-end design of a long-form infographic exploring the intersection of solar-powered homes, blockchain tokenisation, and the rising strain of AI infrastructure on global energy grids. What began as a rough content idea evolved into a multi-format storytelling artefact—with deliverables tailored for LinkedIn carousels, investor decks, and long-scroll web formats. This was a deep-dive into visualising complex systems, built from scratch using a research-led and iteration-heavy design process.
Starting with the Brief
The project kicked off in Jira, where I created a detailed ticket outlining the goals, audience (investors, insurance companies, energy professionals), and format constraints for each version of the graphic. This is also where I captured all early discussions—such as technical requirements for LinkedIn carousels and clarifying what kind of messaging would resonate with an investor audience.
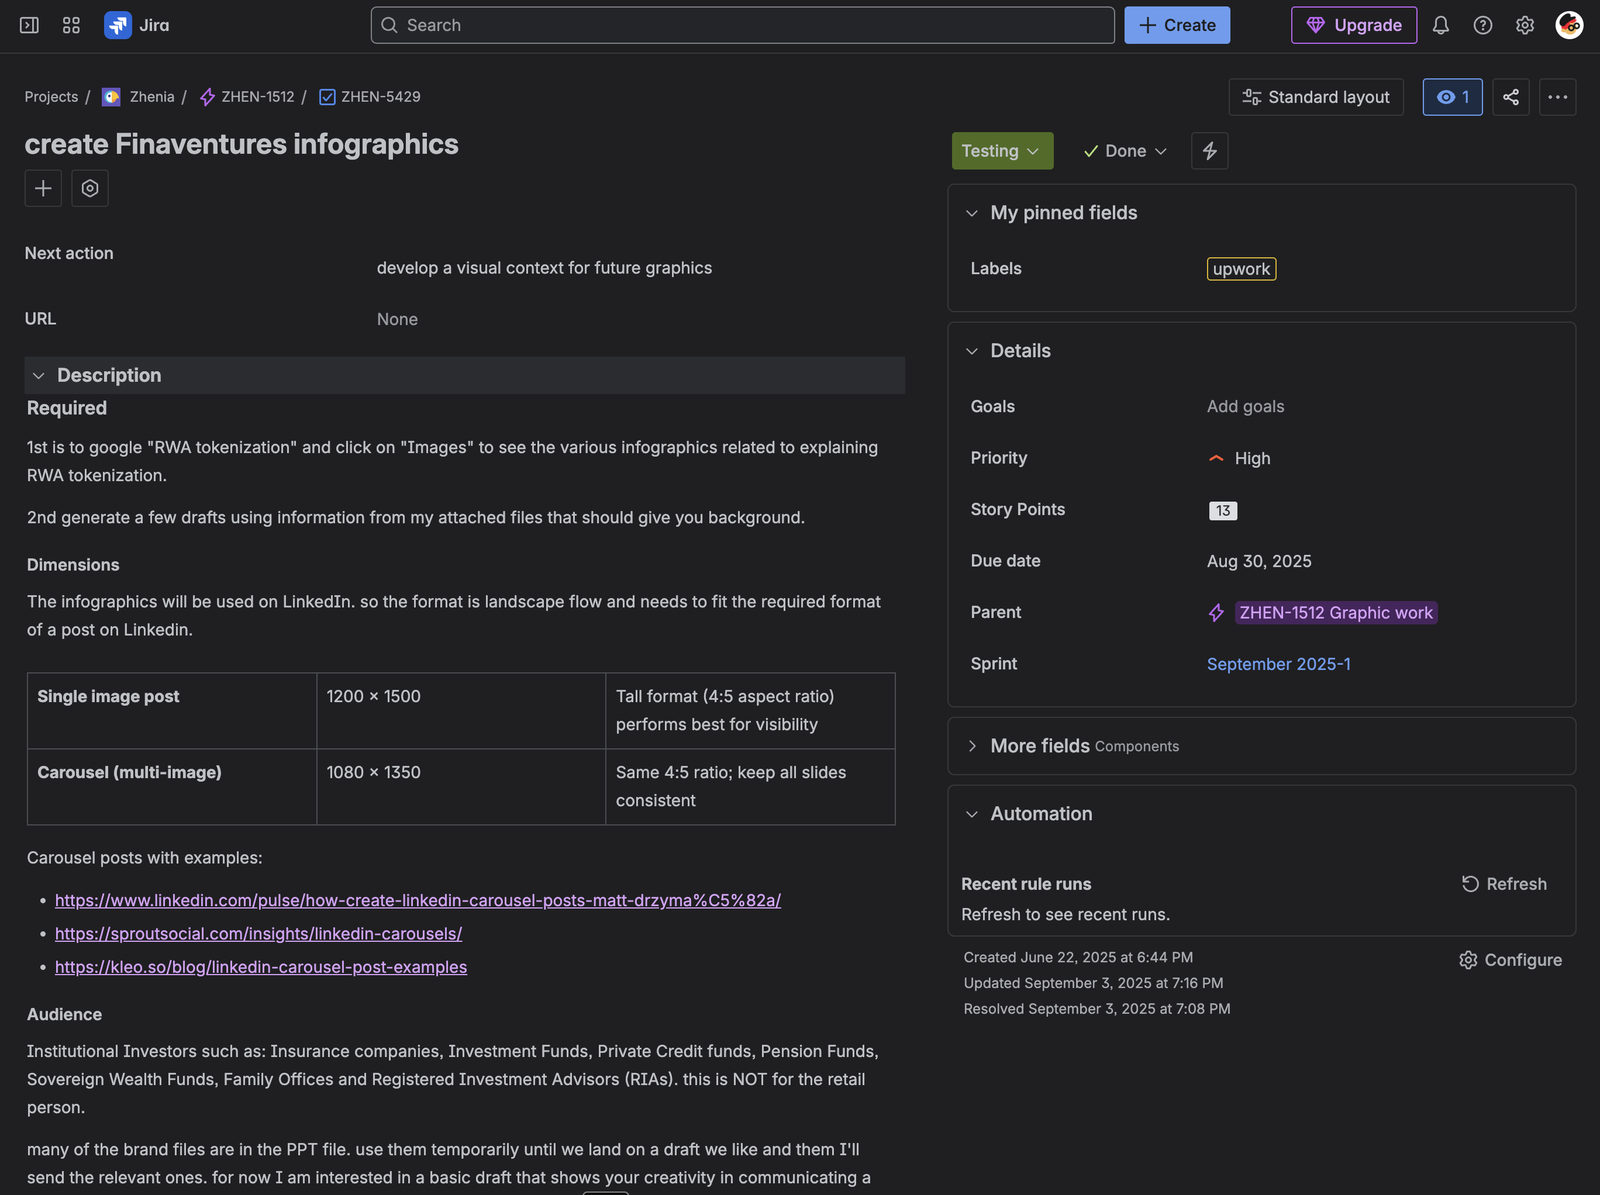
The central question I needed to answer visually was this: How do the economic benefits of solar battery home investments via RWA tokenisation compare to traditional energy infrastructure under increasing AI energy demand? That single question anchored every design and storytelling decision that followed.
The Research Layer
Because this was a high-stakes, unfamiliar topic, I invested significant time in upskilling myself fast. I used Elicit, an AI-powered research tool, to structure an academic literature review. It helped me discover relevant papers and summarise them by investment model, grid impact, and real estate dynamics.
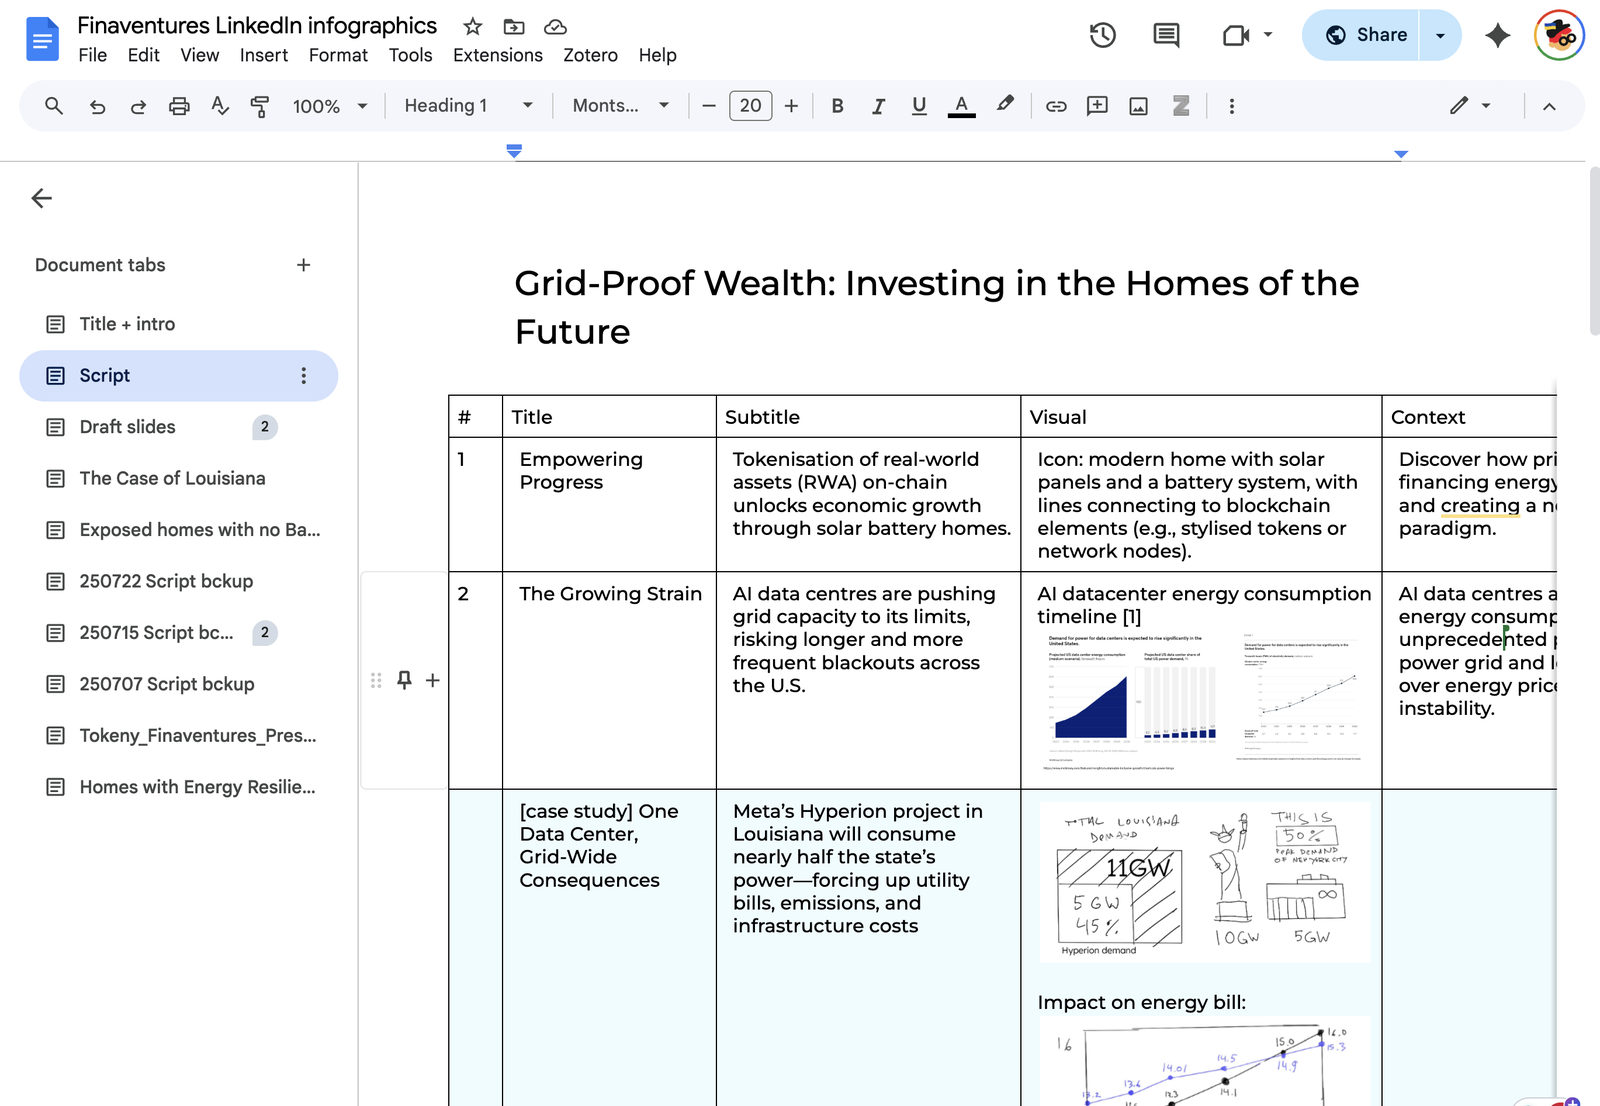
In parallel, I built out a Google Doc with multiple tabs: - Title and intro variants - A working script - Slide-by-slide breakdown: title, visual type, context, and citations - A source list for all datasets and graphics
This became a shared working document with the client, letting us iterate quickly before committing to design.
Moodboarding the Visual Language
Next, I opened Illustrator and began crafting a visual mood board. This included: - Charts and data styles from McKinsey, Reuters, and AI impact reports - AI-generated imagery using Sora, based on my references - Sample iconography and potential illustration styles
The goal at this stage was to define tone and texture: clean, professional, and investor-ready. The client opted for a muted palette—greens, blues, and dark tones—with fewer playful graphics and more emphasis on clarity.
→ 250623_finaventures_infographic_moodboard.pdf
Illustration and Data Moodboard.
Sketching the Story
Rather than diving straight into visuals, I created hand-drawn pencil sketches for the full infographic. These quick, rough layouts allowed me to map the entire narrative structure: - Section headers and narrative beats - Types of visualisations (bar, stacked, line, flowcharts, spike diagrams) - Layout rhythm and transitions
Pencil sketches are the easiest place to iterate. I swapped visual types, changed chart styles, added callouts—all without opening Illustrator.

Digital Iteration in Illustrator
Once the layout felt solid, I created digital drafts. The process looked like this: - V1: Live text over pencil-sketched visuals - V2: AI-generated and moodboard-sourced graphics dropped into layout - V3+: Custom vector illustrations replacing placeholders
Each version was saved with daily timestamps (June 15 to Aug 27) to track progress, delays, and client revisions. I also used grid overlays to align visual elements and maintain hierarchy across formats.

Refining for Multiple Outputs
After finalising the long-scroll infographic, I adapted it into: - A LinkedIn carousel (square format) - A PowerPoint deck (investor pitch adaptation)
This required careful reflowing of layouts—especially callouts and diagrams that didn’t fit the new aspect ratios. I created alternate visual versions where needed (e.g., turning bar charts into column stacks) and retested legibility at multiple sizes.
→ 250827_finaventures_infographic_linkedin slides.pdf
A version for the LinkedIn carousel.
Final Visuals and Delivery
The final result includes: - Custom illustrations of solar homes, batteries, and AI data centres - Bespoke charts showing energy demand trends and investment returns - Icons and vector assets built from scratch
All files were delivered in multiple resolutions and formats. The project took 96 hours over 13 working days, with substantial gaps for client input and revision.
Final Thoughts
This project was a perfect example of why infographics aren’t just about visual appeal—they’re about orchestrating clarity, narrative logic, and layered expertise. If you’re working on a high-concept topic and need someone who can bridge the gap between research and design, this is the kind of process I bring to the table.
Contact
For further inquiries or project collaboration, reach out via the portfolio contact form or provided email.
Looking to transform your digital presence?
get in touch →